Have you ever heard of a geographic information system (GIS)? ESRI, the leader in the GIS software market, explains that GIS is a computer-based tool for mapping and analyzing things that exist, and events that happen, on earth. “GIS mapping helps us interpret data in a different way. Unlike graphs or narratives, it provides a visual representation of data at the most precise level.” said Jared Nineberg, CCRC’s Senior GIS Analyst.
And there’s a good chance that you’ve used it in your daily life.
According to GIS Lounge editor Caitlin Dempsey, “GIS has already affected most of us in some way without us even realizing it. If you’ve ever used an Internet mapping tool to find directions, congratulations, you’ve personally used GIS.”
At CCRC, GIS mapping is being used every day to help with community assessments, outreach and advocacy – and to pinpoint where to put new Head Start locations and child care centers. “CCRC carries out GIS mapping to figure out where our parents and providers are so that we can target our resources and services in those areas.” Nineberg added.
CCRC’s ongoing community assessments uncover assets (positives like social services and hospitals) and disincentives (negatives like liquor stores and food deserts) to determine the basic health of the community. This is just one example of how GIS mapping at CCRC helps planners and community advocates see what’s really needed in the community.
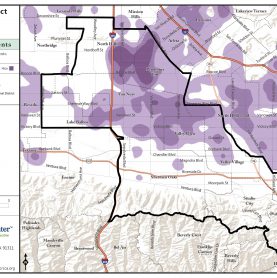
This Assembly District 46 map shows the spatial density of CCRC’s child care recipients. A legislature may look at this map and say, “we have X amount of money for child care services, so where are we going to focus this money?” GIS maps like this would help legislatures in that difficult decision-making process.
As part of CCRC’s strategic plan, it’s currently digitizing and tweaking analog forms, improving its data collection system and looking to post some GIS maps online for all to see.


